


Digest #09 - 4 Commands to Check Memory Usage in Linux

As sysadmin or Linux power user in some cases, we may run out of memory, resulting in very slow response times or our server becoming unresponsive, and you will want to know how much memory is being used by the process.
Here are 4 ways to monitor memory usage on your system.
1. free command
The most commonly used command for determining a Linux system's memory usage is free. It displays total, used, and free memory information.
The free command displays information about physical memory and system swap.
The free command is mostly used with the -h option which tells free to print the output in human-readable format:
$ free -h
Here’s what each column represents:
total - The total amount of memory available to applications.
use - memory that has been used. It is computed as follows: used = total - free - buffers - cache
free - unused / free memory
shared - Ignore this column; it is only shown for backward compatibility.
buff/cache - the memory used by the kernel buffers, page cache, and slabs combined. This memory can be reclaimed at any time if the applications require it.
available - An estimate of the available memory for starting new applications without swapping.
2. htop, top and btop++
htop, btop++, and top are command-line utilities that display real-time information about the processes that are running. They also display the system summary, which includes memory usage.
Here's an example of htop:
$ htop
The output header contains information about the system's total, free, and used physical and swap memory.
The %MEM column indicates how much of the available physical memory is being used by each running process.
3. /proc/meminfo
The simplest method to check RAM memory use is to display the contents of the /proc/meminfo virtual file. This file is utilized by the free, htop, top, ps, and other system information commands.
To read the contents of the /proc/meminfo file Linux text viewer of your choice for example cat. As for me I prefer to use batcat a modern cat version with syntax highlighting:
$ bat /proc/meminfo
The file contains a wealth of information regarding the system's memory and swap usage. The /proc/meminfo file contains information that can be readily parsed and used in shell scripts.
4. A bonus: Using GUI (system monitor):
It is uncommon to use a graphical interface for system administration. Certain data sets, on the other hand, are much clearer, providing a visual representation of memory utilization.
To access memory usage on the System Monitor, follow these steps:
Navigate to your applications and search for system monitor
Open system monitor
Select the resource tab on the system monitor app
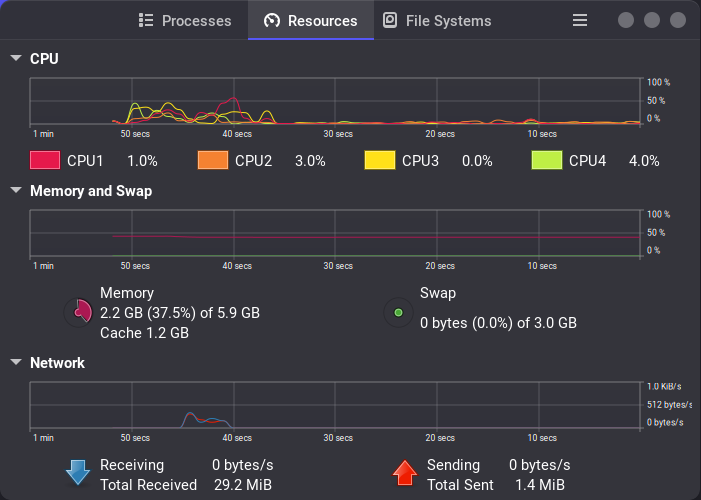
A graphical representation of your real-time memory consumption, including historical data, is provided.
Summing up
That's all! Thank you for getting this far. I hope you find this digest useful.